The newest version of Simple Data Logger contains significant performance and usability improvements.
Multicolored event log
The event log shows the data received from your connected device. The parts of this data which were captured to be logged are now highlighted. In the example below, we recorded data sent from an Ohaus STX scale intentionally set to transmit lots of data:
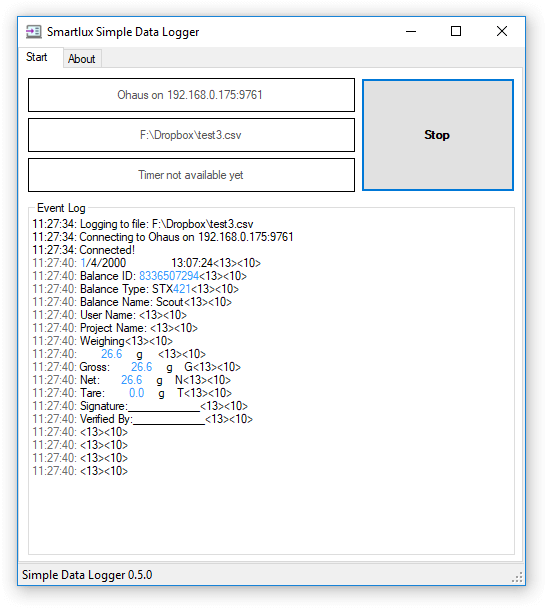
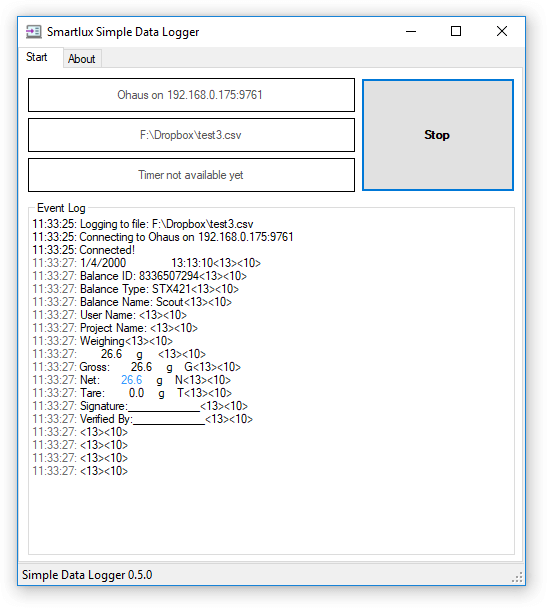
As you can see, many undesired values were captured. After a simple change to the regular expression which SDL uses to match and capture data, only the net weight was recorded:
The new multicolored event log is a very useful tool for troubleshooting.
Other improvements:
- Improved responsiveness of the user interface even when data is received at very high rates.
- Time for each line of data is now recorded after the first byte has been received (previously: when entire line was written to the file).
- Program will warn you if you’re trying to exit while data collection is still running and will shut down gracefully if user confirms exit intent.
- “Closed” message appears in event log after stop button is pressed (when port/socket has been closed).
- “A&D” name is now shown correctly in start tab (with ampersand).
2 thoughts on “Version 0.5.0”